Welcome to the 5th UK Property Market Stats Show of 2025, your go to weekly TV show on the UK Property Market on YouTube
This week, I’m joined by the awesome Kristian Stott, as we delve into the key property market headlines for 5th week of 2025 ending on the 9th February 2025.
The YouTube Show
https://lnkd.in/eMxxgAnh
✴️ UK Property Market Highlights this week
✅ Listings (New Properties on the Market)
36.5k new listings this week (last week 35.9k)
That’s 11% higher than Week 5 of 2024 YTD and 11% higher YTD compared to 2017/18/19.
✅ Price Reductions (% of Resi Stock)
21.5k Price Reductions this week - meaning an approx run rate of 1 in 8 of Resi Sales stock per month is being reduced (12%).
For comparison, 11.9% average in 2024, though the long-term 5-year average is 10.6%.
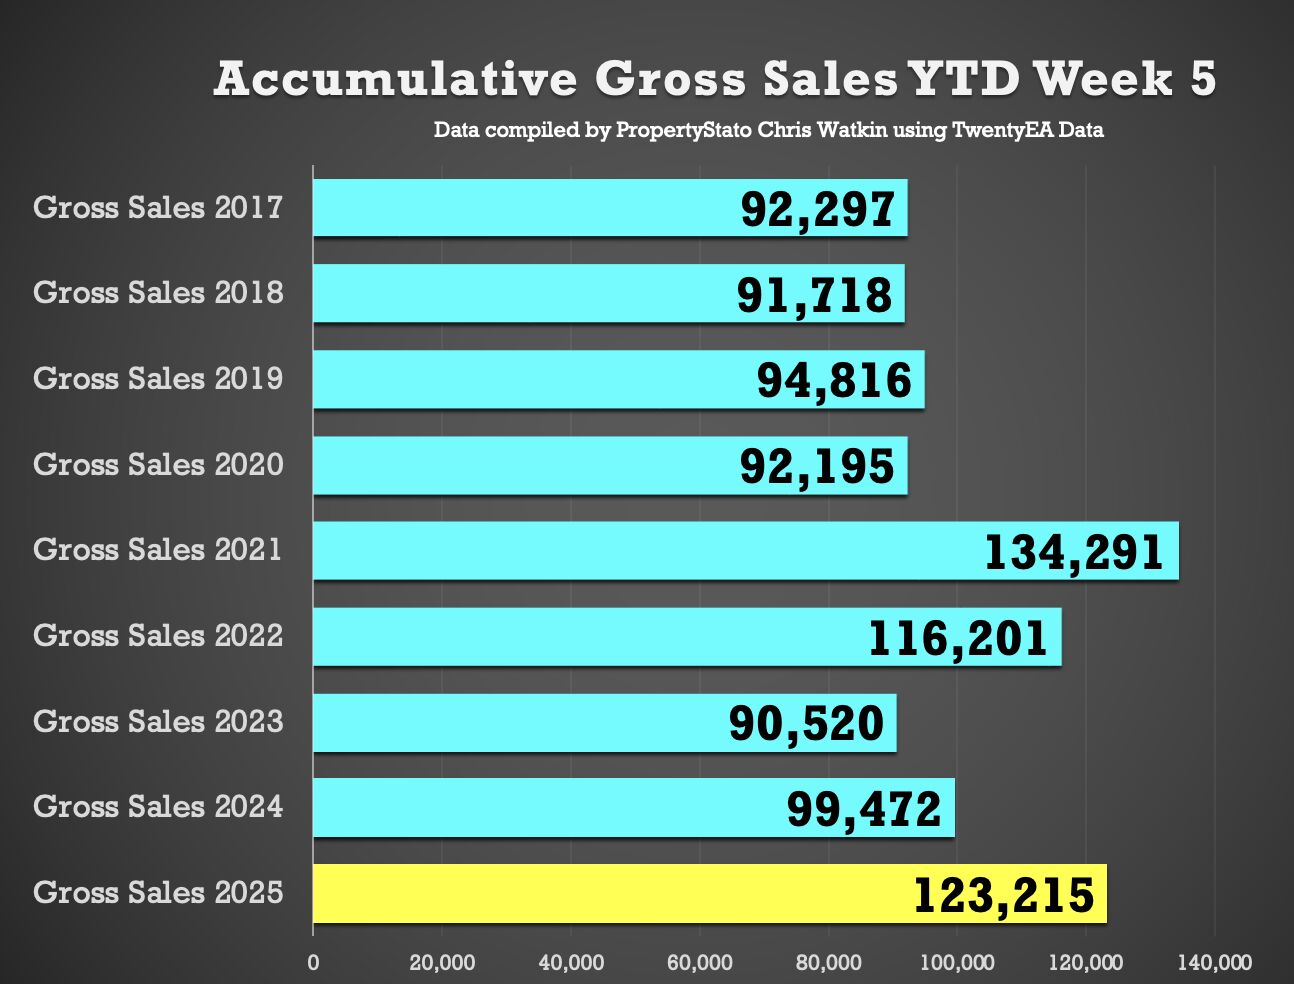
✅ Total Gross Sales (Agreed Sales)
27k UK homes sold STC this week, down from 27.5k last week in Week 4
That’s 24% higher YTD compared to 2024 and 33% higher than 2017/18/19 YTD levels.
✅ Sale-Through Rate (Monthly in Arrears)
January’s Run rate of 15% of Resi stock sold stc. For comparison, 13.9% of residential sales stock sold in January 2025. 2024 monthly average: 15.3%. Long-term 8-year average: 17.9%.
✅ Sale Fall-Throughs
6,406 Sale fall-thrus last week from Resi Sale Sales Pipeline of 440,431 homes sale agreed (sold stc).
Another method is that week’s sale fall thrus as a % of gross sales that week. This week, that is 23.7% (last week 22.5%). Still slightly below the 7-year average of 24.2%, but well below the 40%+ levels post-Truss Budget (Autumn 2022).
For January ’25 as a whole, 6.03% of sales in the UK agents pipelines fell thru in Jan 25. For comparison, 2024 average: 5.36%.
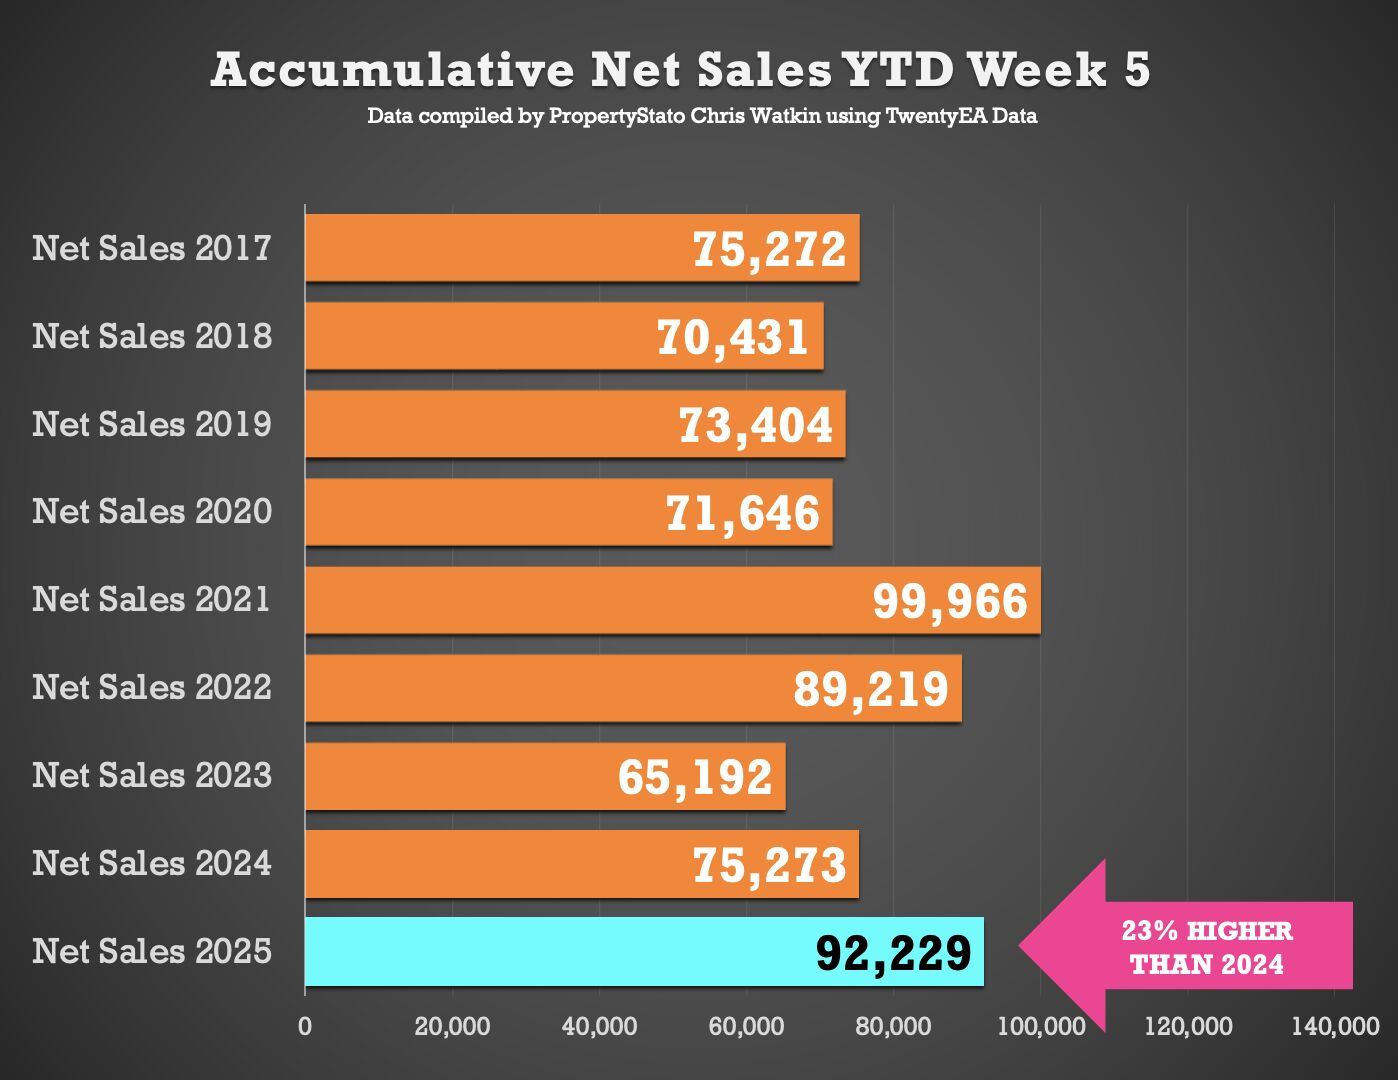
✅ Net Sales (Gross sales for the week less Sale Fall Thrus for the week)
20.6k net sales this week, compared to a typical week 4 average of 19.4k. Last week
Week 4 2025 - 21.3k. 18.4k is the weekly YTD 2025 average.
2025 YTD is 23% higher than compared to 2024 YTD and 26% higher than YTD 2017/18/19.
Have a great week
Christopher
Property Stato