UK PROPERTY MARKET WEEKLY UPDATE — Week 26, 2025
Welcome to the 26th UK Property Market Stats Show of 2025 — your go-to weekly YouTube ‘TV Show’ on the UK property market.
This week, I’m joined by Kristian Stott, as we unpack the key headlines from the 26th week of 2025, ending Saturday 6th July 2025
▶️ Watch on YouTube:
https://lnkd.in/eF4wE6r6
🔍 Key Market Stats – Week 26 of 2025
✅ Listings (New to Market)
36,900 new listings this week (Up from 36.7k last week)
YTD listings are 4.7% higher than 2024 YTD and 7.7% above the 2017–19 YTD average
(968k YTD vs 924k in 2024)
✅ Price Reductions
27,500 reductions this week (Up slightly from 26.7k)
That’s 1 in 7.1 homes on the market being reduced monthly (14.1%)
For context:
• 14% in June & 13.4% in May
• 12.1% average in 2024
• Long-term 5-year average: 10.6%
✅ Sales Agreed
26,600 homes sold STC this week (↓ from 27.5k last week)
YTD agreed sales:
• 7.7% up on 2024 (691k vs 641k)
• 15.6% up on pre-Covid average (600k in 2017–19)
✅ Sell-Through Rate (June, in arrears)
15.3% of properties on the market went SSTC in June
That’s down from 16.1% in May
2024 average: 15.3%
8-year average: 17.9%
✅ Sale Fall-Throughs
6,664 fall-throughs last week (from a 496k SSTC pipeline)
Fall-through rate as % of gross sales: 25.1% (up from 23.7% last week)
Slightly worse than the long-term average of 24.2%, yet far below post-Truss chaos levels (40%+)
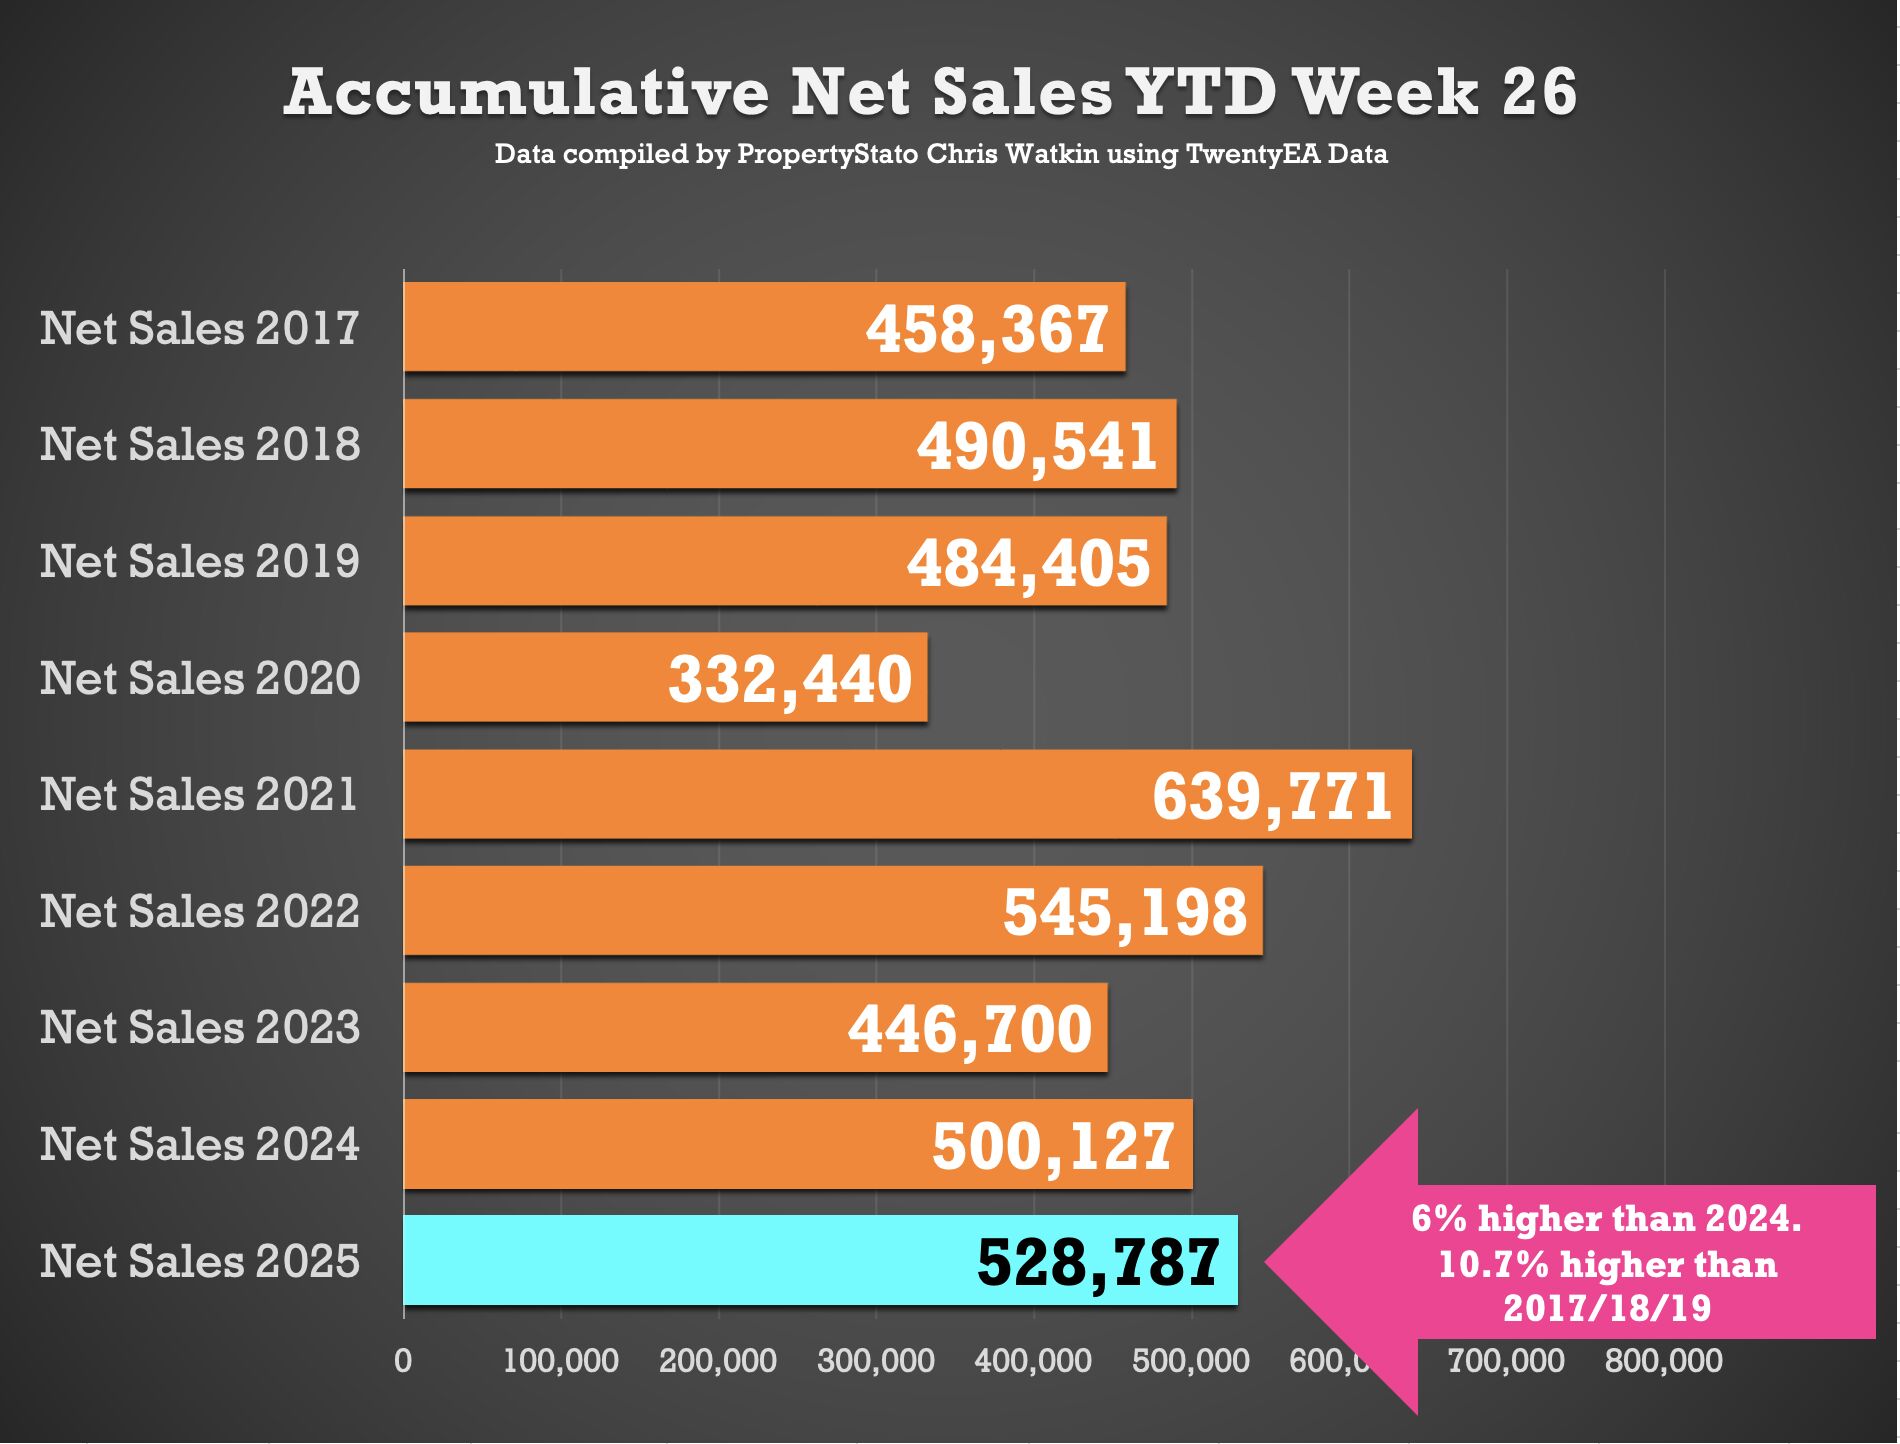
✅ Net Sales
19,900 net sales this week (↓ from 21.0k last week)
Weekly average for 2025: 20k
YTD Net Sales:
• 529k in 2025
• +5.7% on 2024 YTD (500k)
• +10.7% on 2017–19 YTD (478k)
✅ % Chance the Home will Sell
June stats showed 49.1% of UK Homes that left the estate agents books in June 2025, exchanged contracts (ie the agent got paid and the home moved on completion), the remaining 50.9% left Estate Agent books, unsold and homeowner staying in their home. NB - this June stat will change throughout July as more dates comes through.
✅ Stock Levels (For Sale and Sales Pipeline) - 1st of the Month
758k homes on the market at the start of June - 8.3% higher than July 2024
496k homes in Estate Agents sales pipelines - 4.9% than than July 2024
✅ House Prices (measured by £/sq.ft)
£346.45/sqft on Sales Agreed in June 2025 - 2.46% higher than June 2024 and 1.48% higher than June 2022.
✅ Rental Stats
June 2025 with an average rent of £1,826 pcm (June ’24 figure £1,758)
✅ Local Focus: Cleethorpes & Grimsby


Welcome to the 26th UK Property Market Stats Show of 2025 — your go-to weekly YouTube ‘TV Show’ on the UK property market.
This week, I’m joined by Kristian Stott, as we unpack the key headlines from the 26th week of 2025, ending Saturday 6th July 2025
▶️ Watch on YouTube:
https://lnkd.in/eF4wE6r6
🔍 Key Market Stats – Week 26 of 2025
✅ Listings (New to Market)
36,900 new listings this week (Up from 36.7k last week)
YTD listings are 4.7% higher than 2024 YTD and 7.7% above the 2017–19 YTD average
(968k YTD vs 924k in 2024)
✅ Price Reductions
27,500 reductions this week (Up slightly from 26.7k)
That’s 1 in 7.1 homes on the market being reduced monthly (14.1%)
For context:
• 14% in June & 13.4% in May
• 12.1% average in 2024
• Long-term 5-year average: 10.6%
✅ Sales Agreed
26,600 homes sold STC this week (↓ from 27.5k last week)
YTD agreed sales:
• 7.7% up on 2024 (691k vs 641k)
• 15.6% up on pre-Covid average (600k in 2017–19)
✅ Sell-Through Rate (June, in arrears)
15.3% of properties on the market went SSTC in June
That’s down from 16.1% in May
2024 average: 15.3%
8-year average: 17.9%
✅ Sale Fall-Throughs
6,664 fall-throughs last week (from a 496k SSTC pipeline)
Fall-through rate as % of gross sales: 25.1% (up from 23.7% last week)
Slightly worse than the long-term average of 24.2%, yet far below post-Truss chaos levels (40%+)
✅ Net Sales
19,900 net sales this week (↓ from 21.0k last week)
Weekly average for 2025: 20k
YTD Net Sales:
• 529k in 2025
• +5.7% on 2024 YTD (500k)
• +10.7% on 2017–19 YTD (478k)
✅ % Chance the Home will Sell
June stats showed 49.1% of UK Homes that left the estate agents books in June 2025, exchanged contracts (ie the agent got paid and the home moved on completion), the remaining 50.9% left Estate Agent books, unsold and homeowner staying in their home. NB - this June stat will change throughout July as more dates comes through.
✅ Stock Levels (For Sale and Sales Pipeline) - 1st of the Month
758k homes on the market at the start of June - 8.3% higher than July 2024
496k homes in Estate Agents sales pipelines - 4.9% than than July 2024
✅ House Prices (measured by £/sq.ft)
£346.45/sqft on Sales Agreed in June 2025 - 2.46% higher than June 2024 and 1.48% higher than June 2022.
✅ Rental Stats
June 2025 with an average rent of £1,826 pcm (June ’24 figure £1,758)
✅ Local Focus: Cleethorpes & Grimsby